
What have I learned from the past 4 years?
Cutting services and people is just as unsustainable as raising taxes too quickly. We have seen the result of the many years of cuts in order to keep tax rises to a minimum. Â While I believe we have a very very efficiently run City, we also have instances where staff are unable to complete the business they are assigned because they simply do not have the time or support to do so. Because of that, amongst other reasons, our staff are burning out or seeking other employment and projects and initiatives are not getting done.
To grow as a City and properly serve our residents we must have enough Human Resources to get the job done.Â
I will advocate for specific and directed increases to staff resources where it is clear more capacity is needed. Â Planning, Economic Development, Building Inspections, Communications, and City Works are places where I think we will see a need for more resources.
Taxes Shares – Finding Stability. Â Should they Stay the Same?
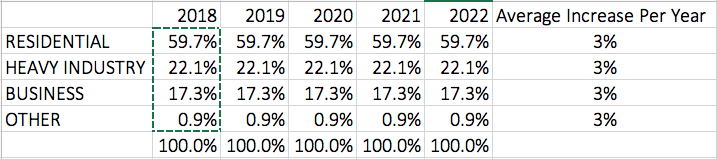
Below are three charts showing tax shares. Â The first from the final five year plan from the previous council, the 2nd showing the actual tax shares during this Council term, and the third, the forecast for the next 5 years.
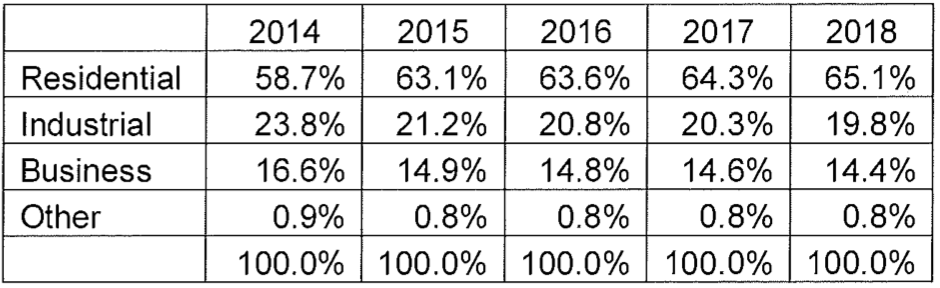
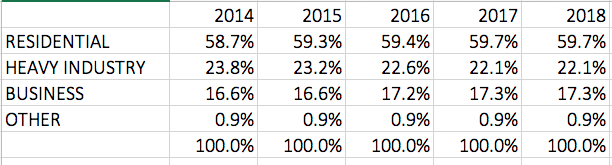
The big difference you should see is that the first chart shows big changes in the tax shares between year one and two. This indicates big increases in taxes. Â This was very common in these five year plans, but every year the big bulge would be moved out one or two years. Â This Council has stopped that practice and has committed to trying to stick to a true Five Year Plan.
Also, after 2017, the Heavy Industry sector agreement to reduce taxes ended. So this enabled Council to apply tax increases fairly, across all sectors, so that the share everyone paid of taxes was the same.
Should these tax shares stay the same?
Have a question or comment? Leave a reply at the bottom of the page!
Residential Tax — How much do you and your neighbours pay?
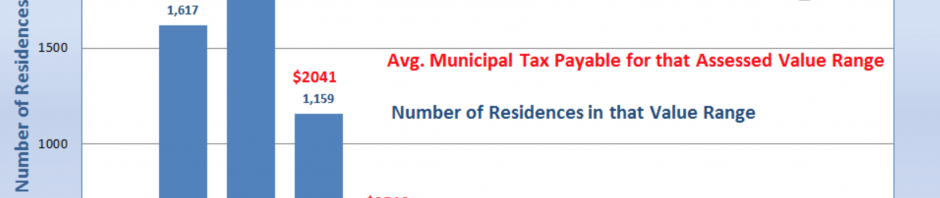
In 2015, the City produced this excellent graph showing the average tax people payed in the City according to ranges of how much their assessed value was.
The “Average Taxpayer” owned a home worth between $150-$200,000 ($185,876) and payed $1,756.
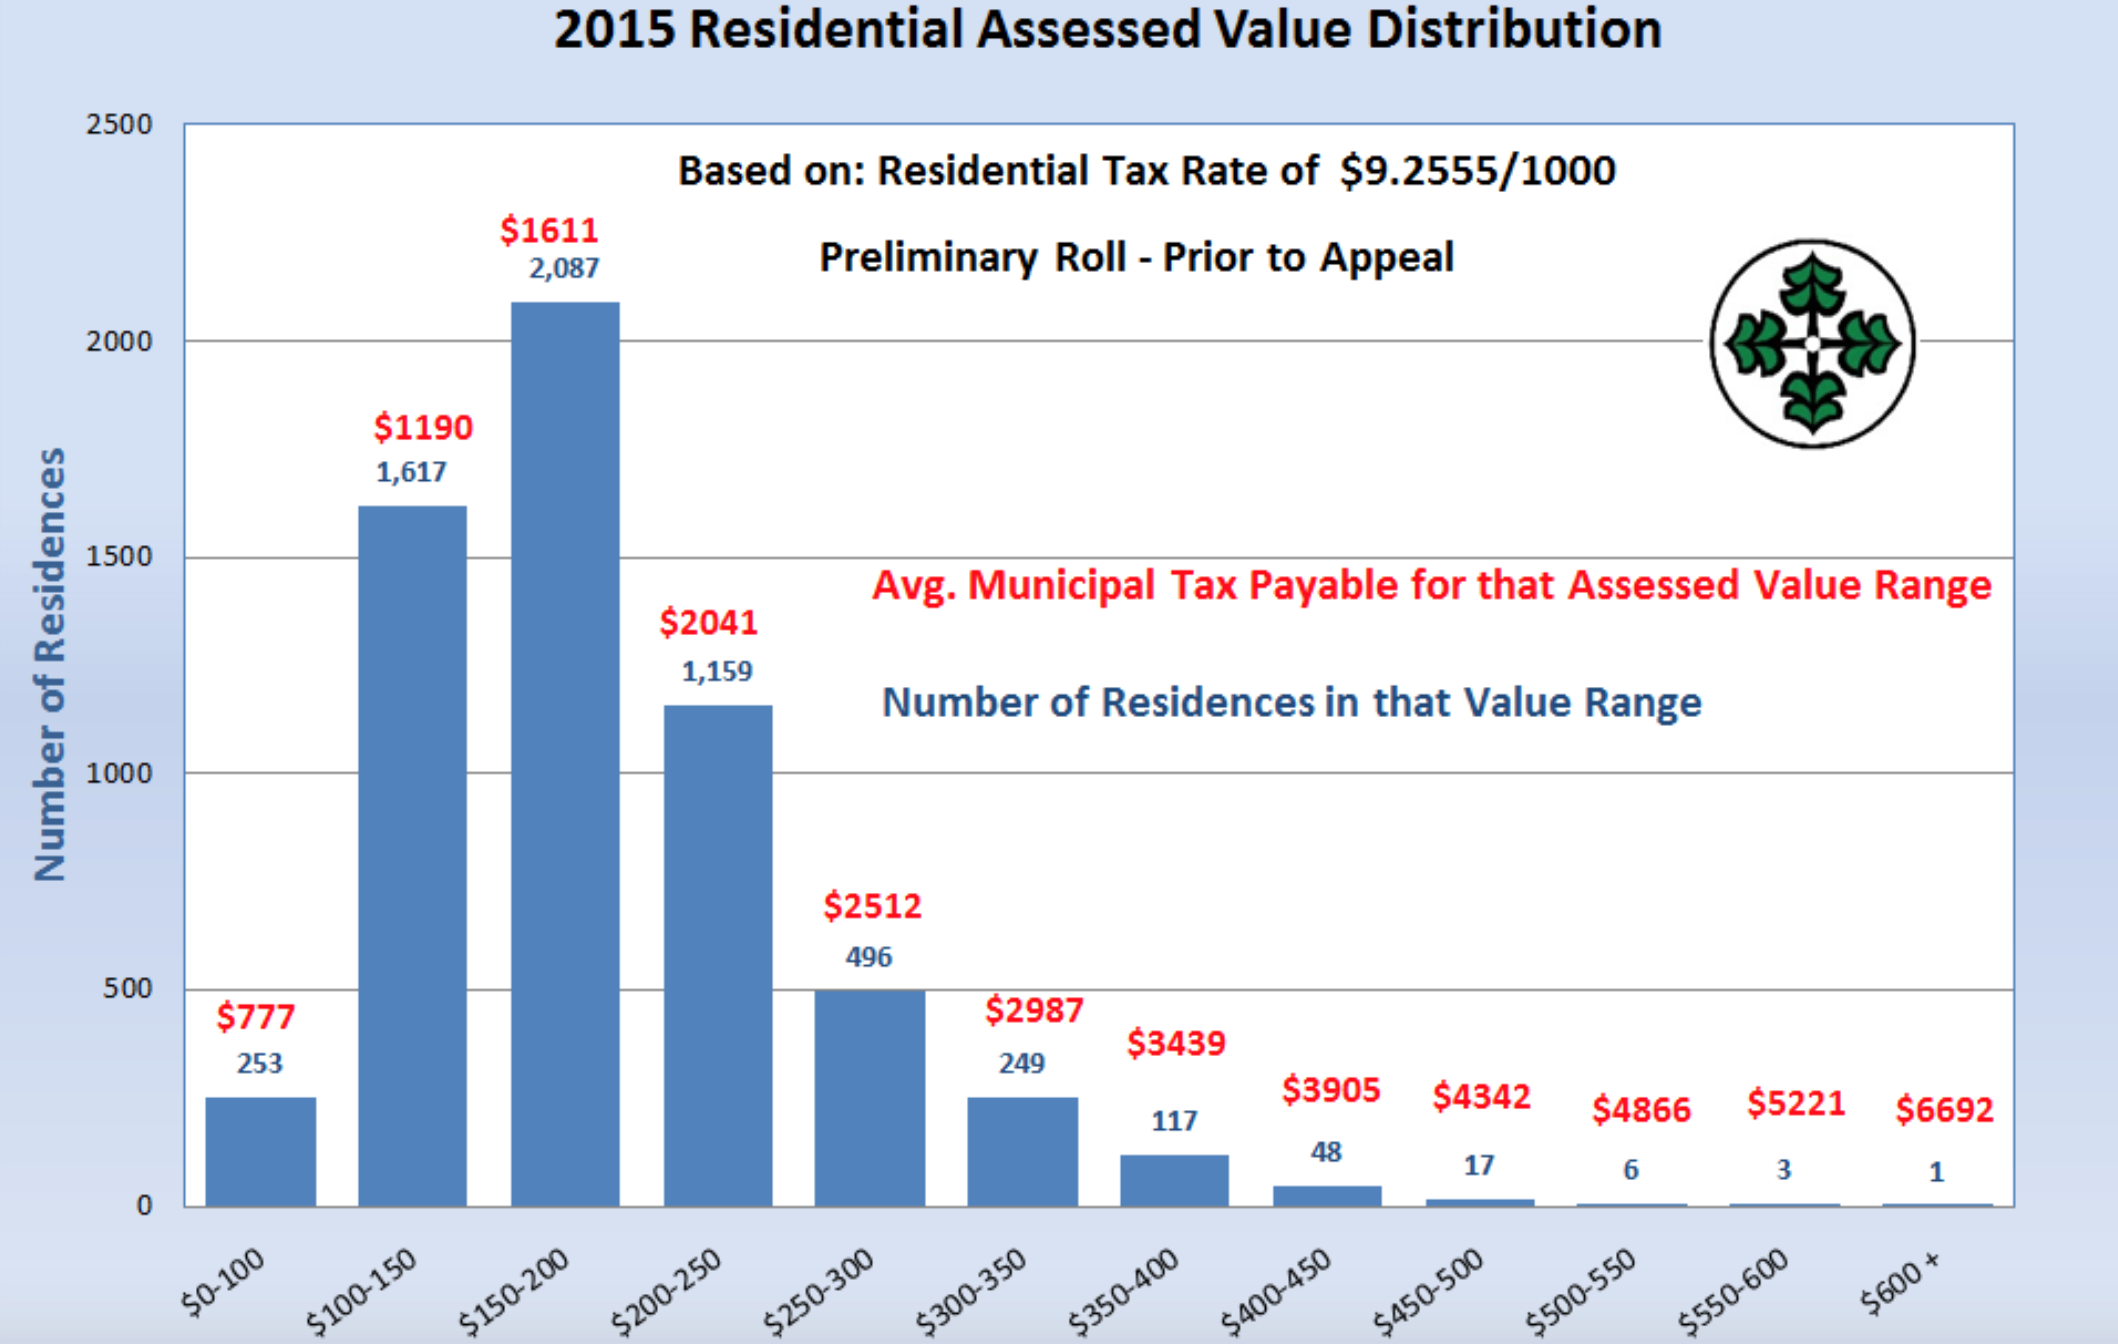
In 2018 that same average home is now worth $247,673… an increase of more than $61,000 and 33% but property taxes have only risen by about $160 to $1,919. That is a great indication that there is interest in our community in the past 3 years and we are keeping our costs down.
In that 3 years, the mil-rate has dropped from 9.4479 to 7.7504 because of the sharp rise in assessed value.
If the graph were created again today, it would look very similar, except the bars would be shifted to the right.
In the previous election I suggested keeping property tax increases to 2%. Â I now understand that even those rises do not cover inflation. If we want to invest in our community, then we will need to commit to increases greater than 3% at least until our population and business growth can provide the increased revenue we need.