
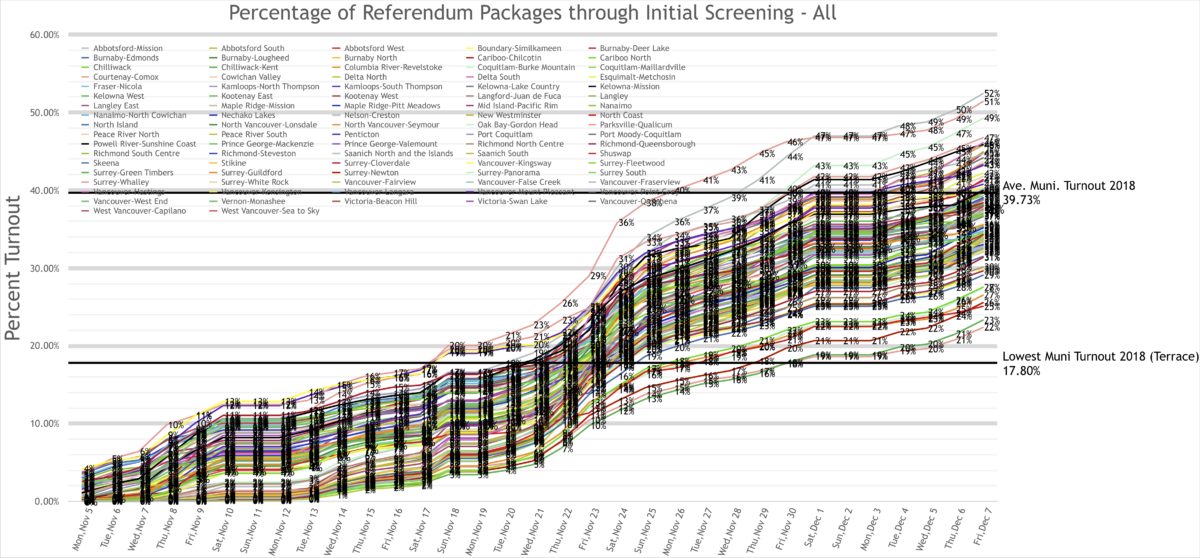
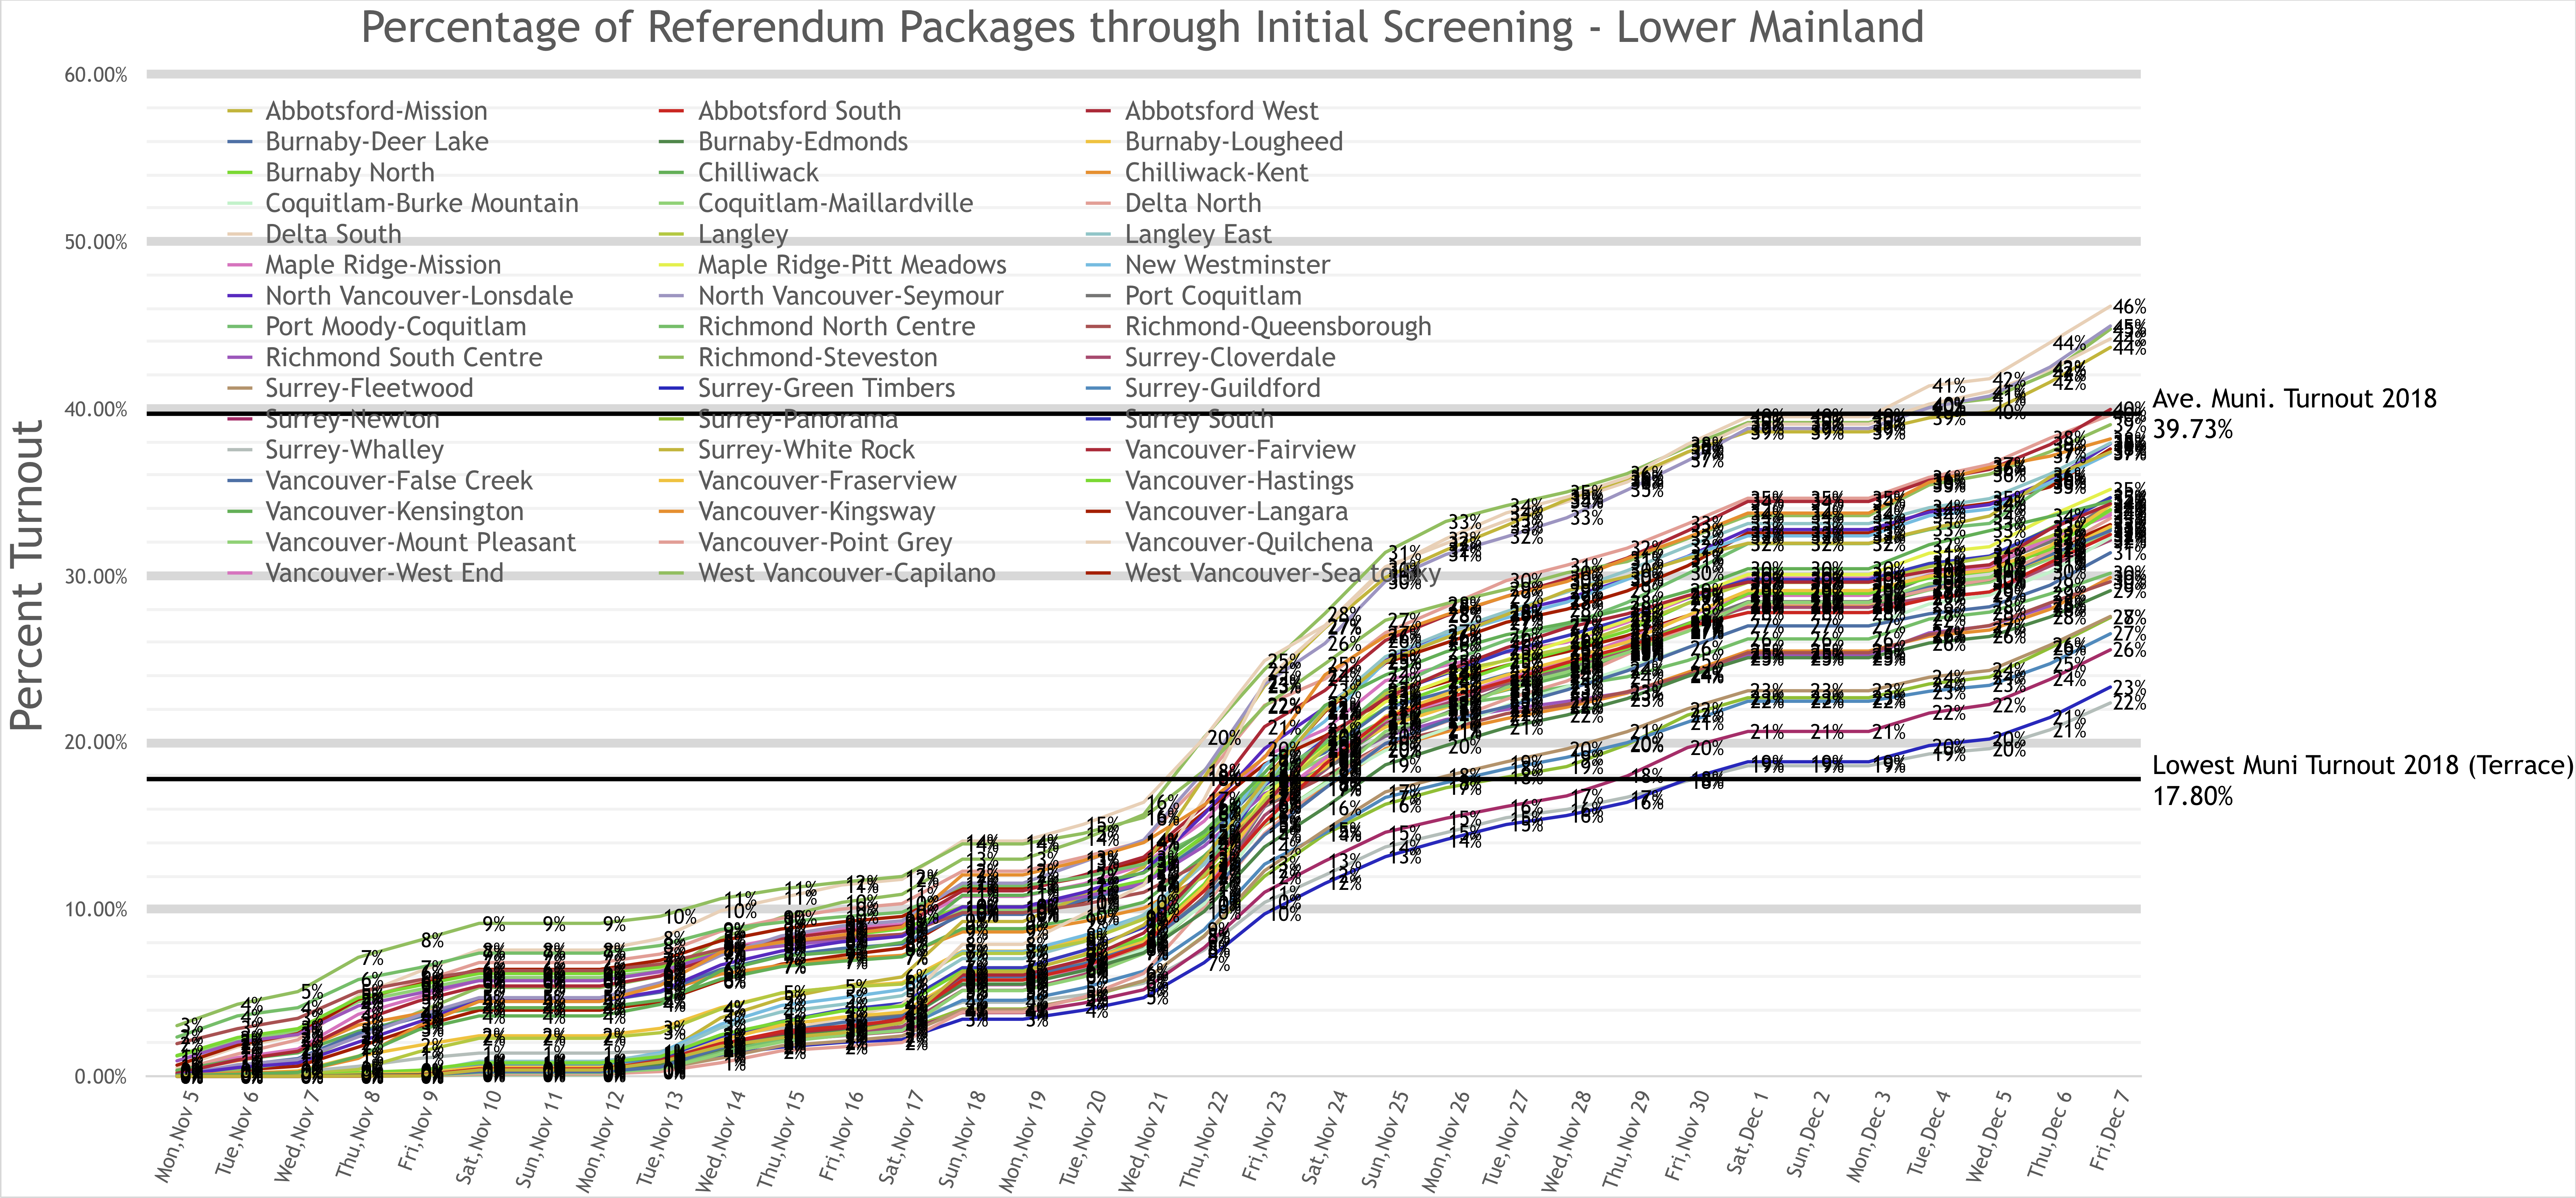
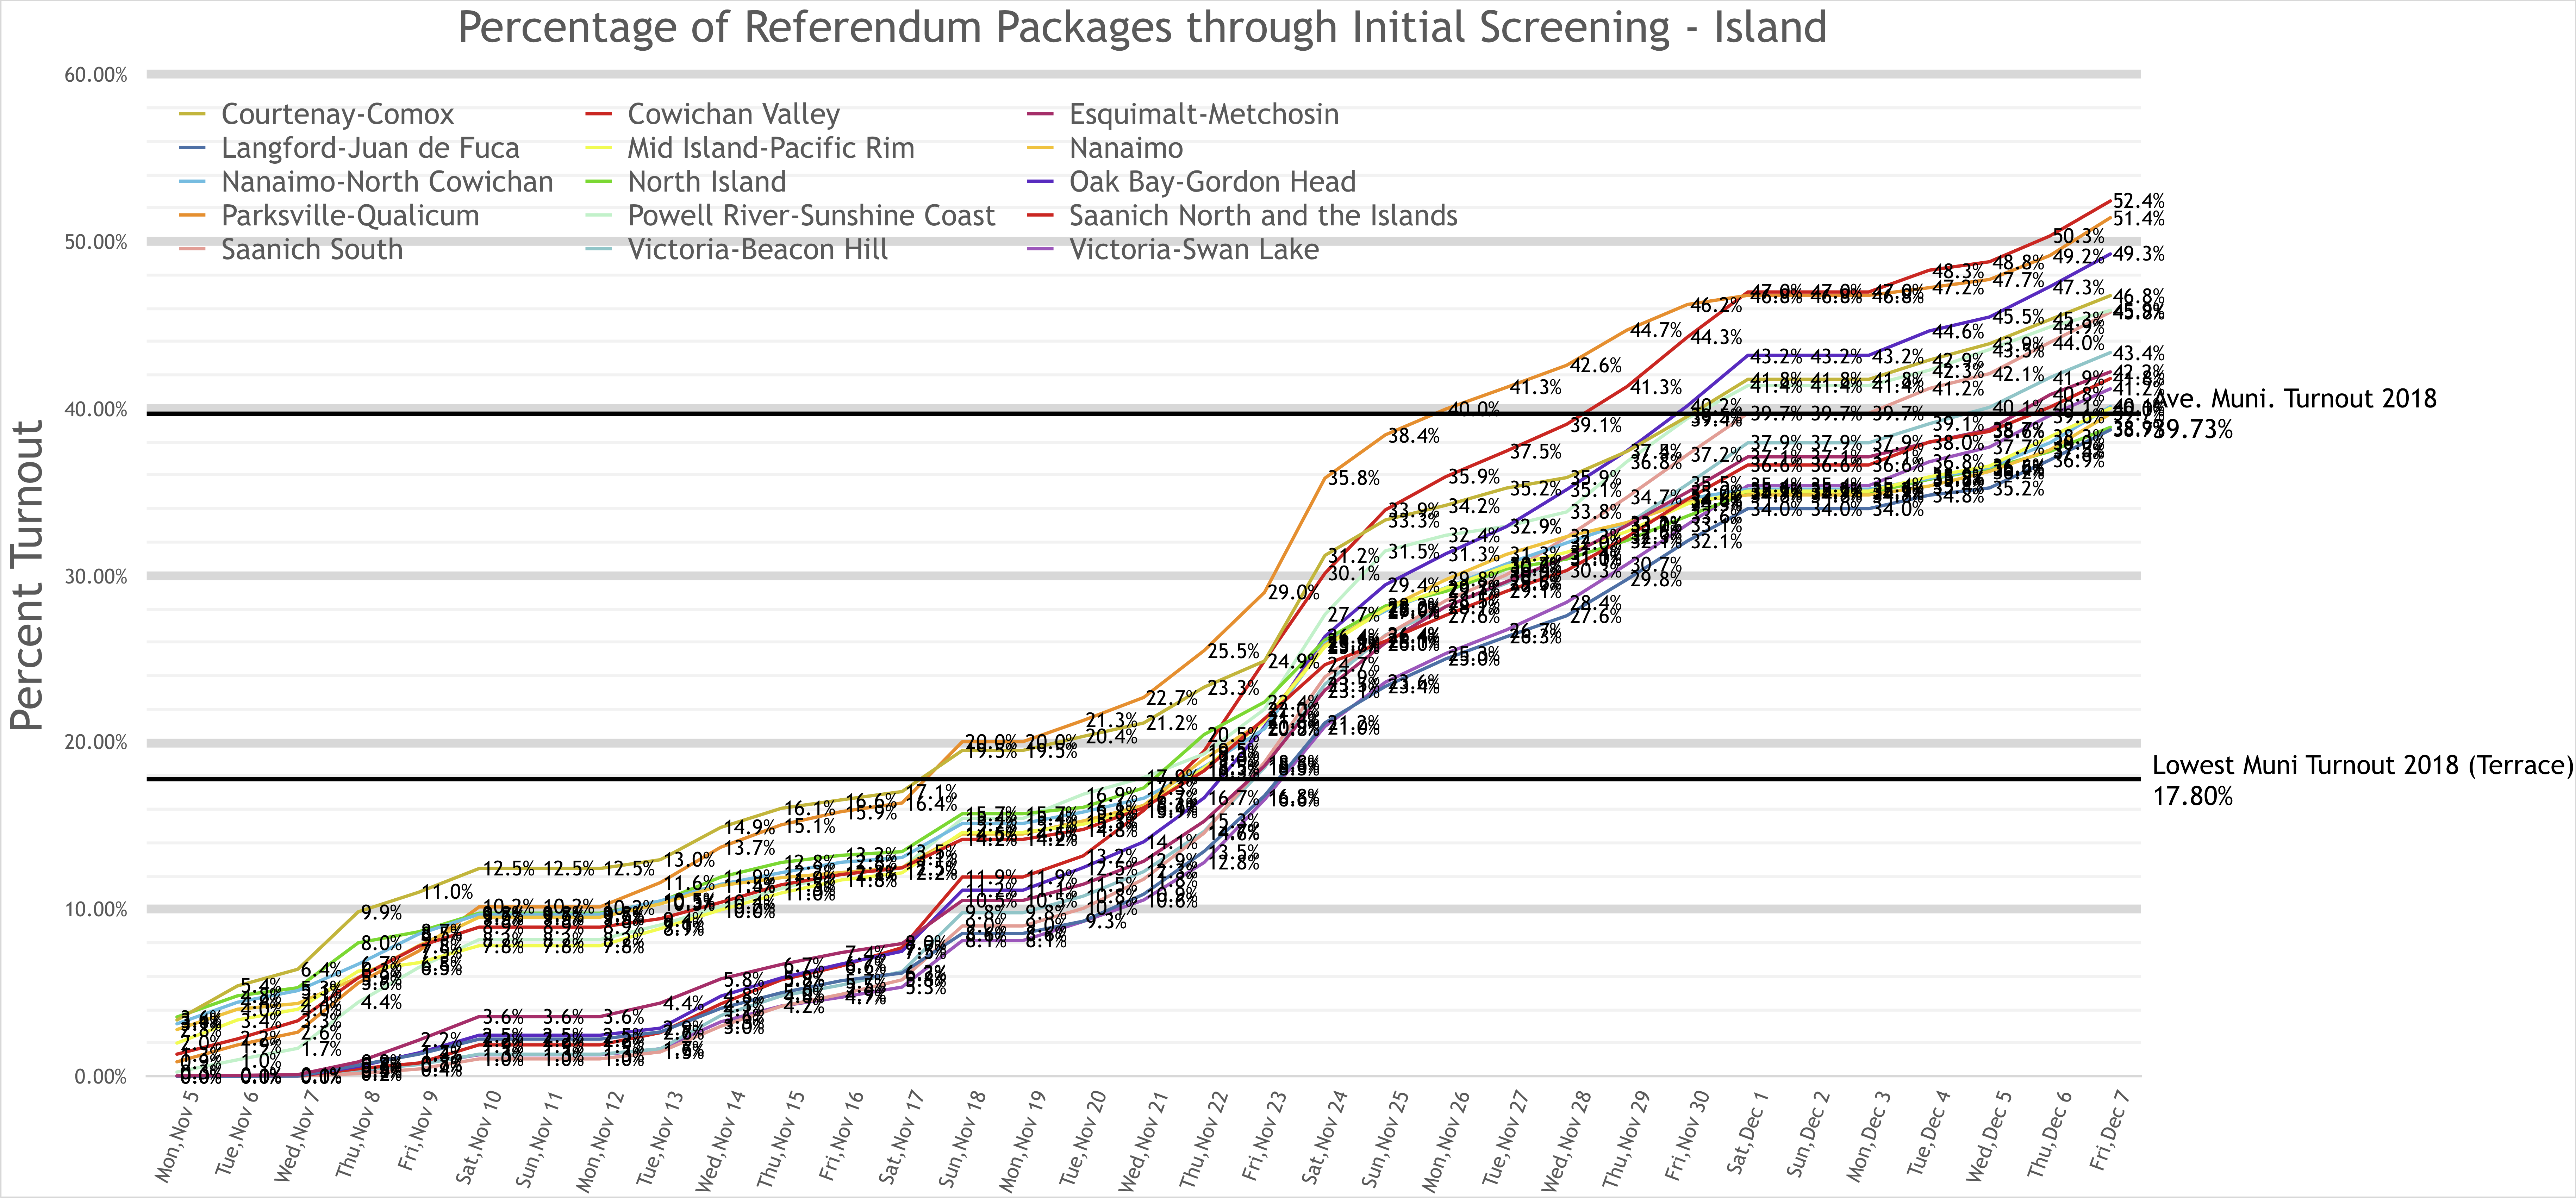
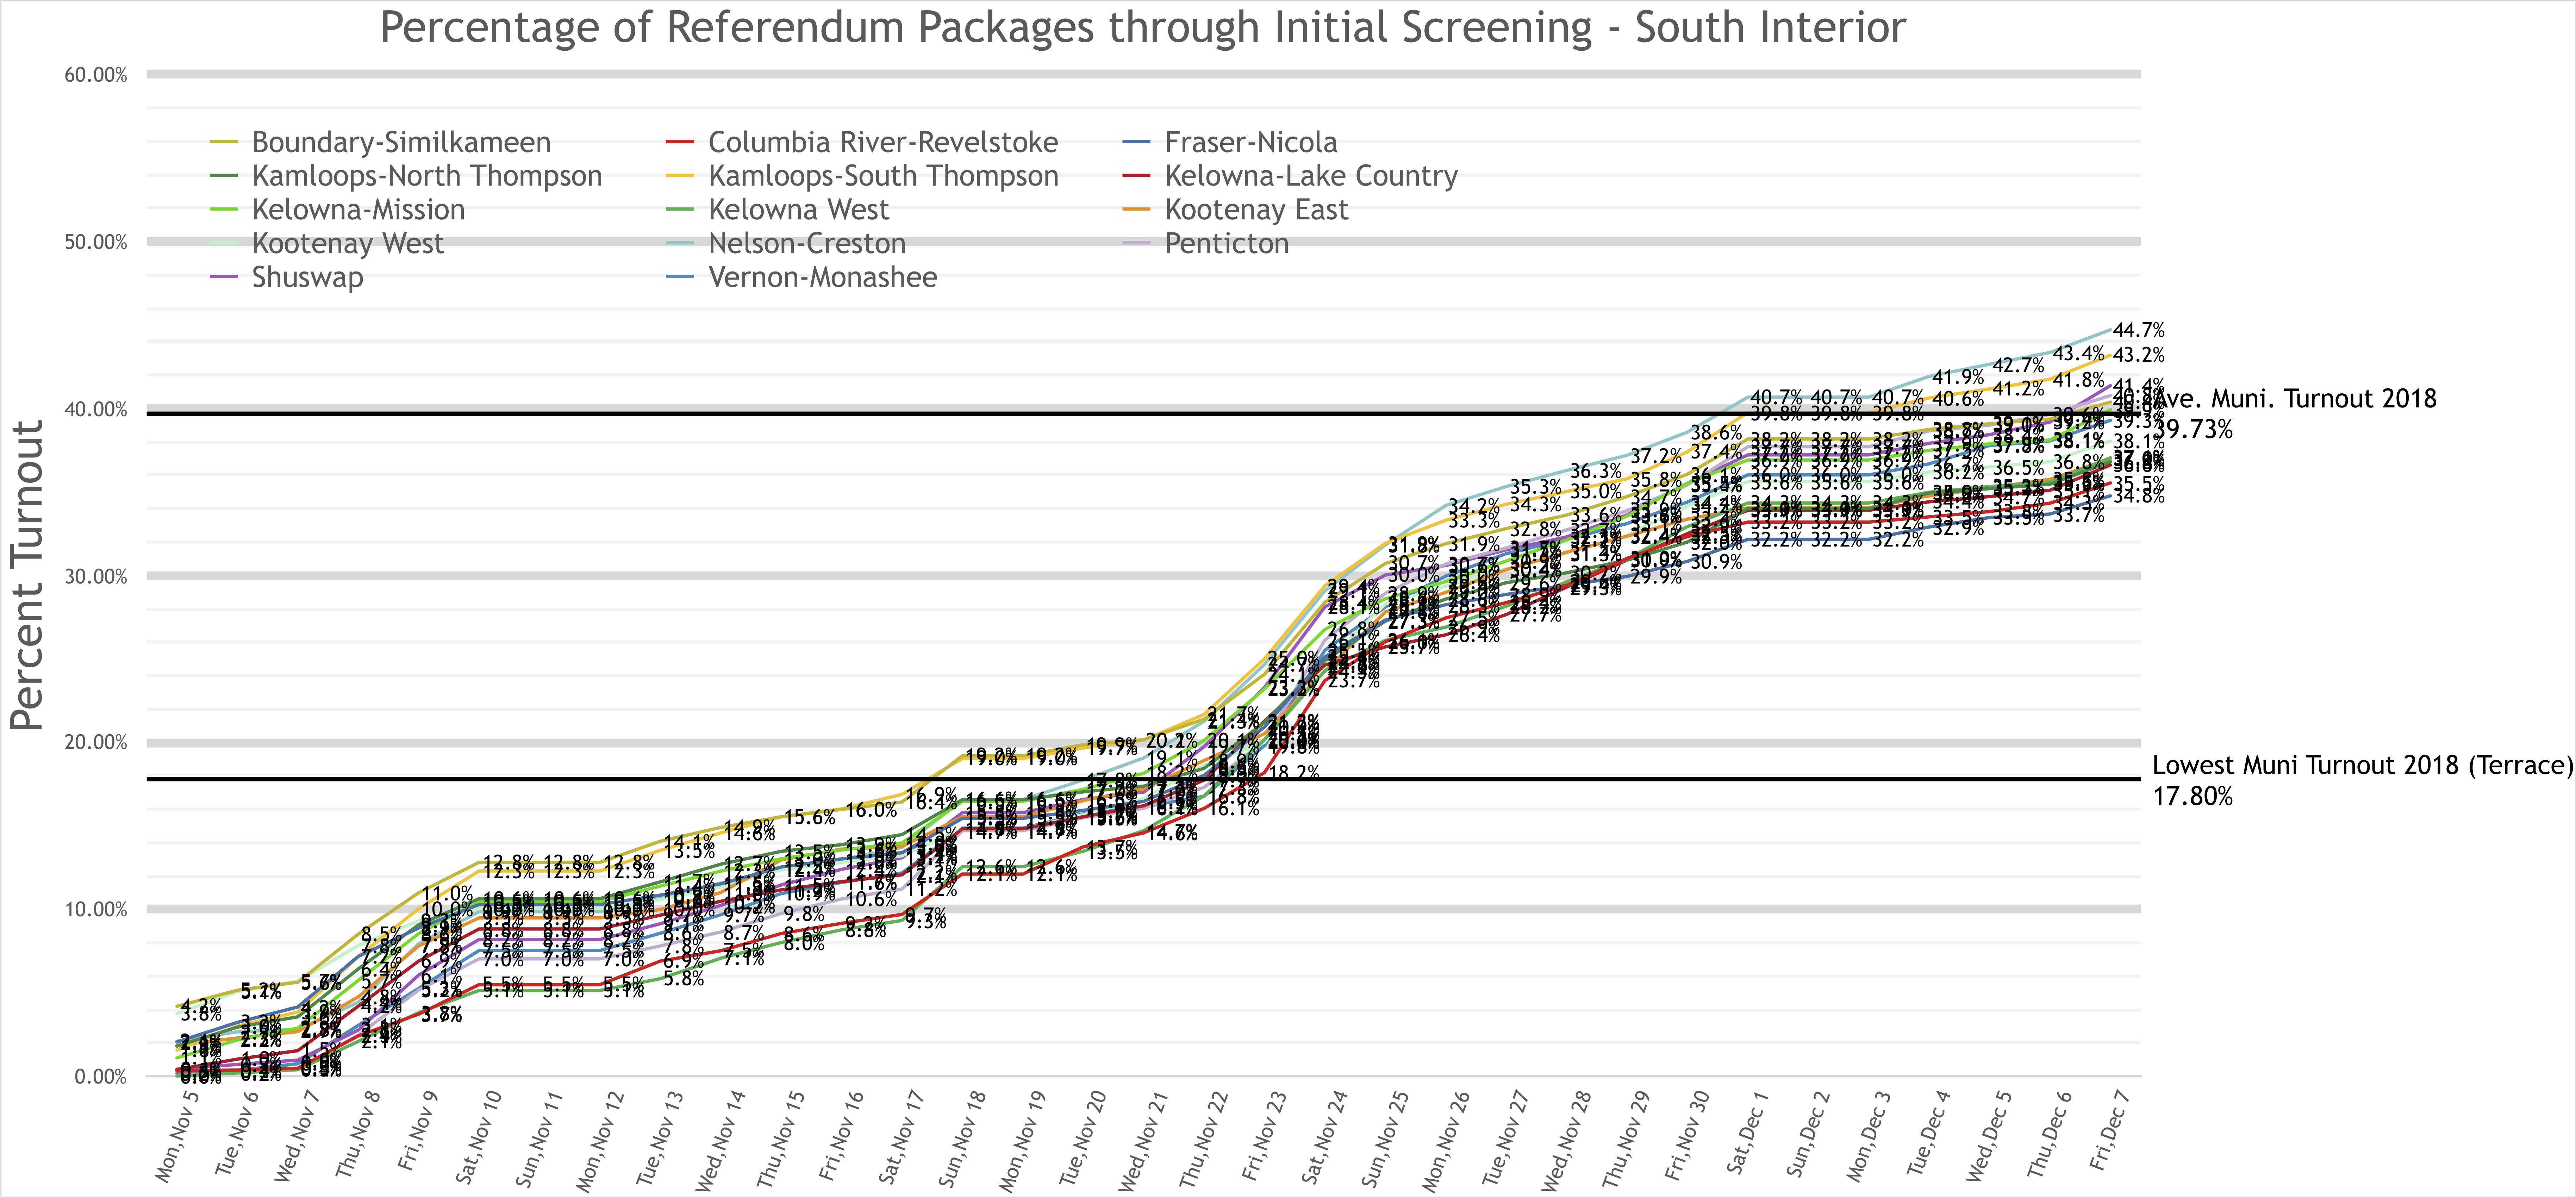
I wrote a blog a few weeks ago poking at the media for making such a big kerfuffle about the “low turnout” in the Referendum after just a few days of data coming back from Elections BC. I noted the differences in numbers indicated a likely connection to patterns in how ballots were mailed out, and perhaps some effects from the Canada Post strike. Also, it was just too darn early to get all crazy.
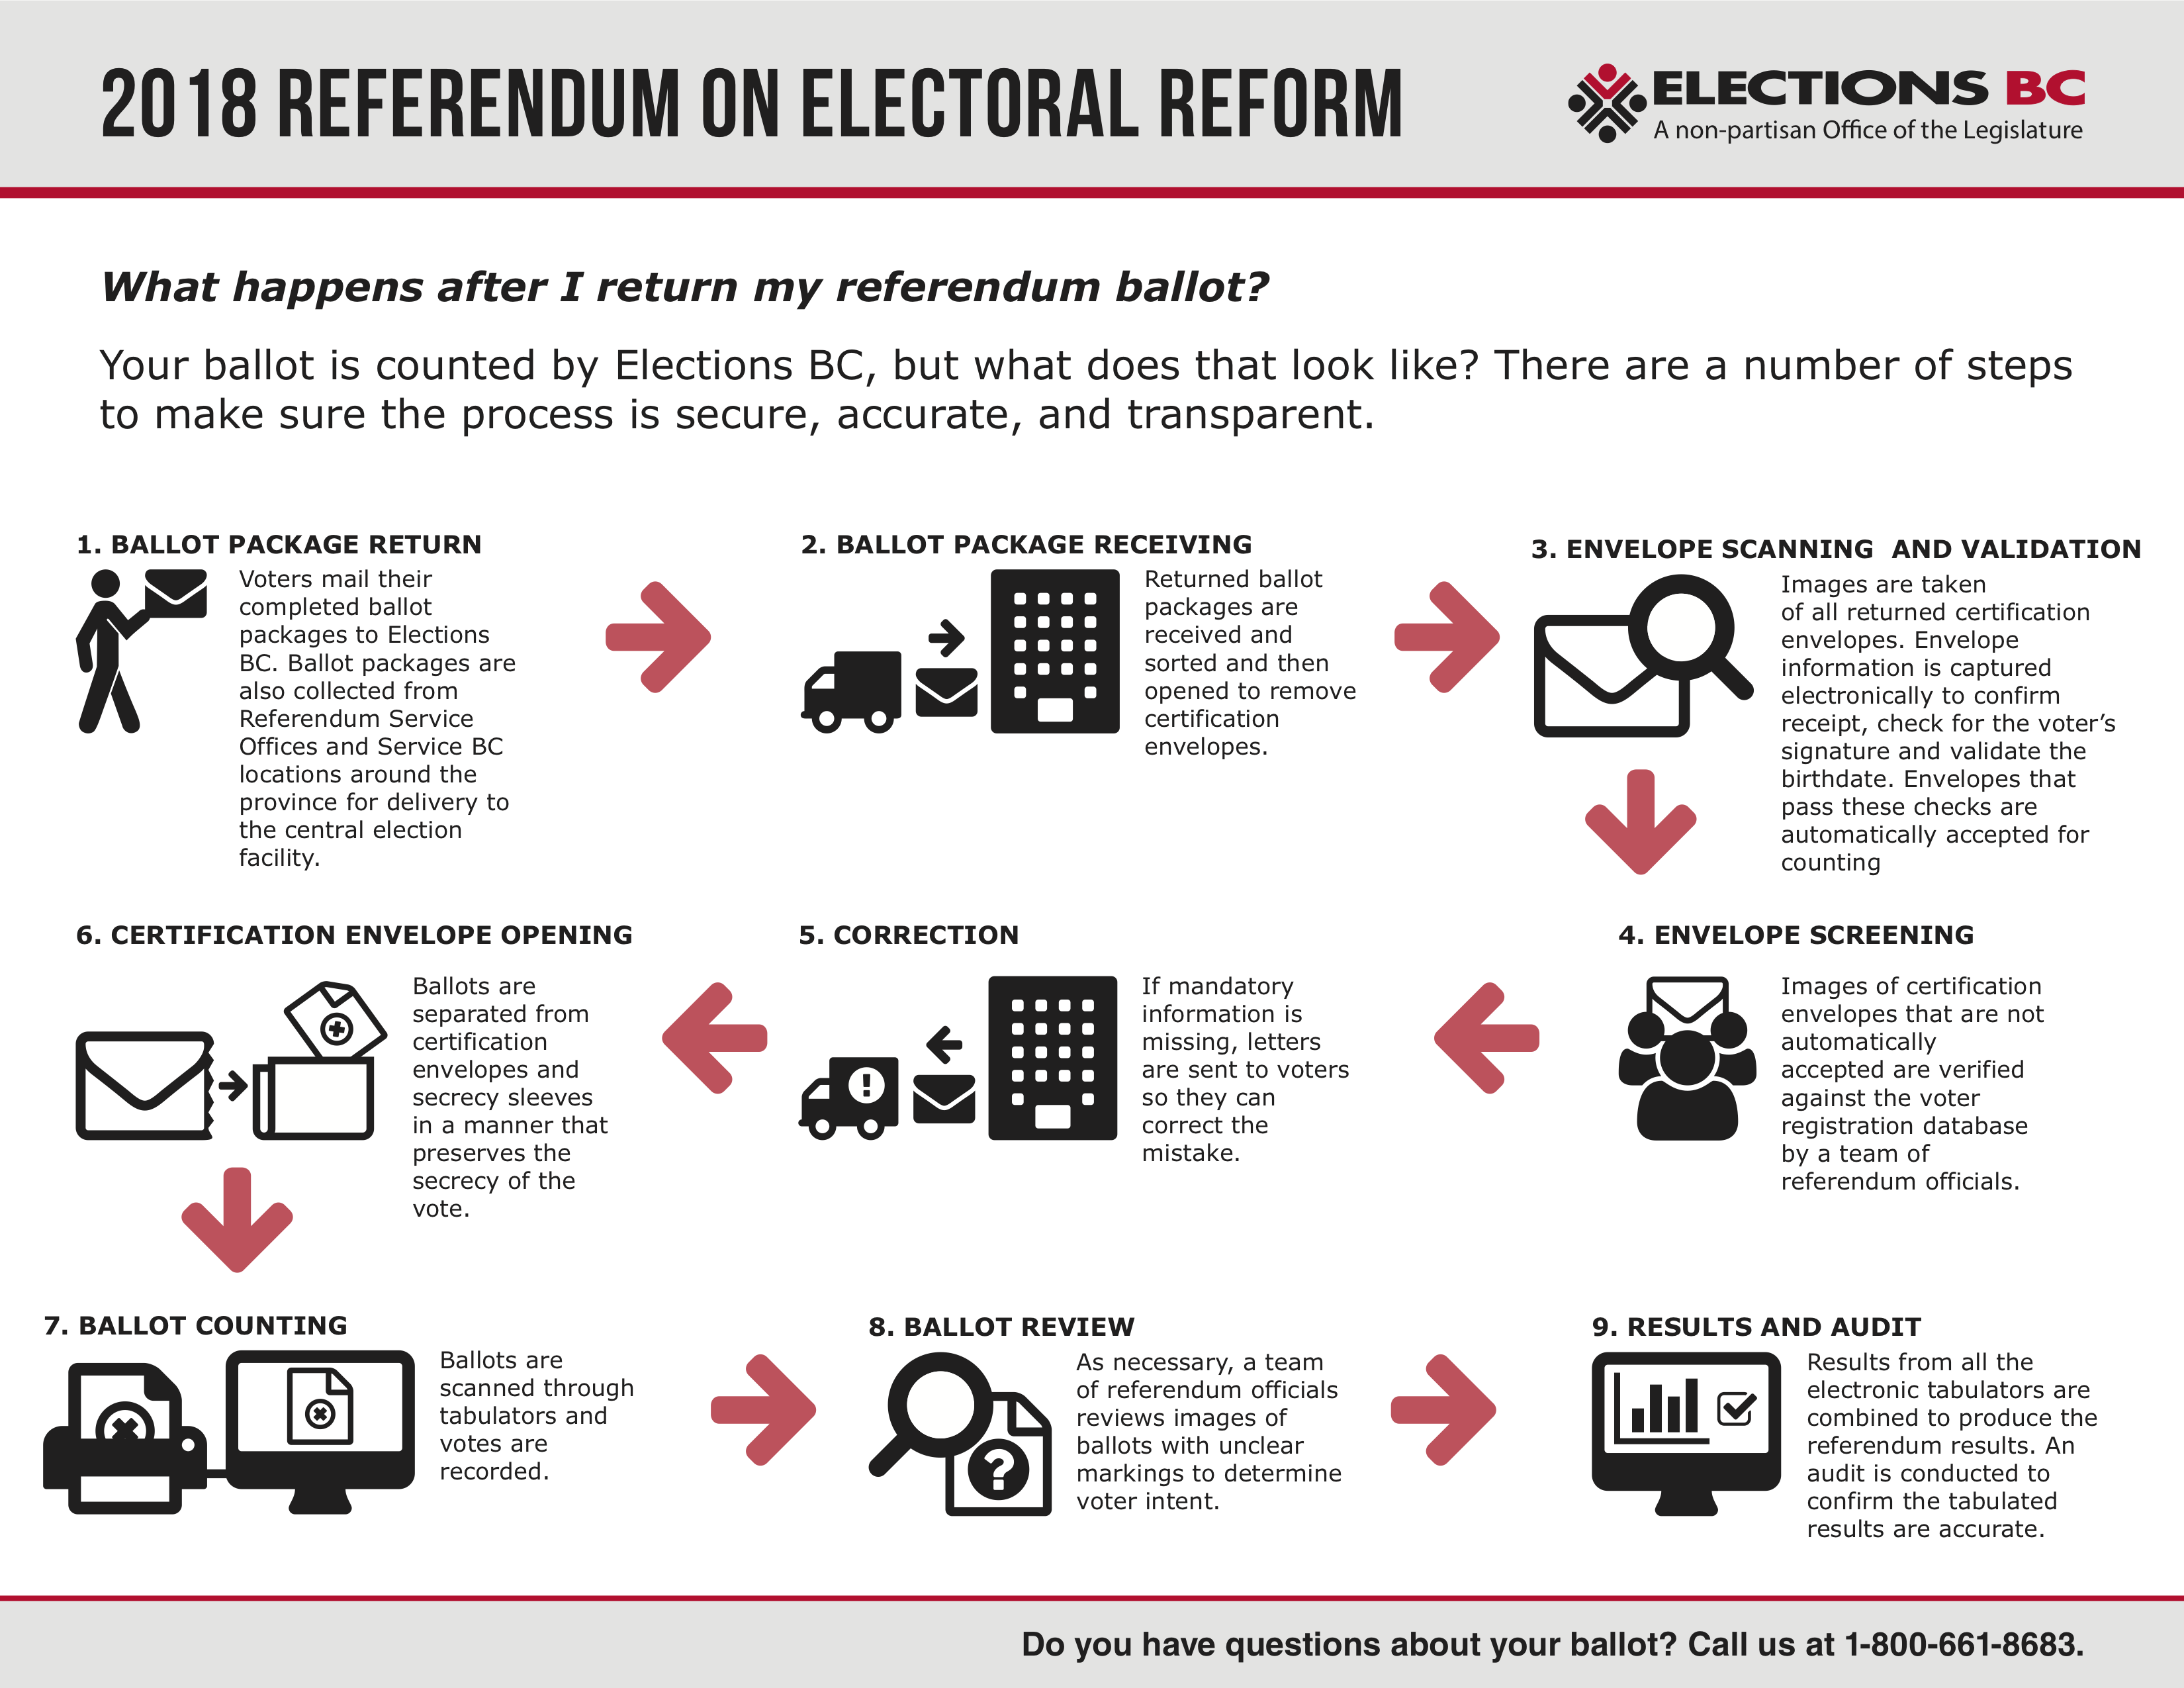
It later turned out that the numbers being reported were not actually received numbers at EBC offices, but rather ballots that had gone through ‘initial screening‘. (Process explainer here)
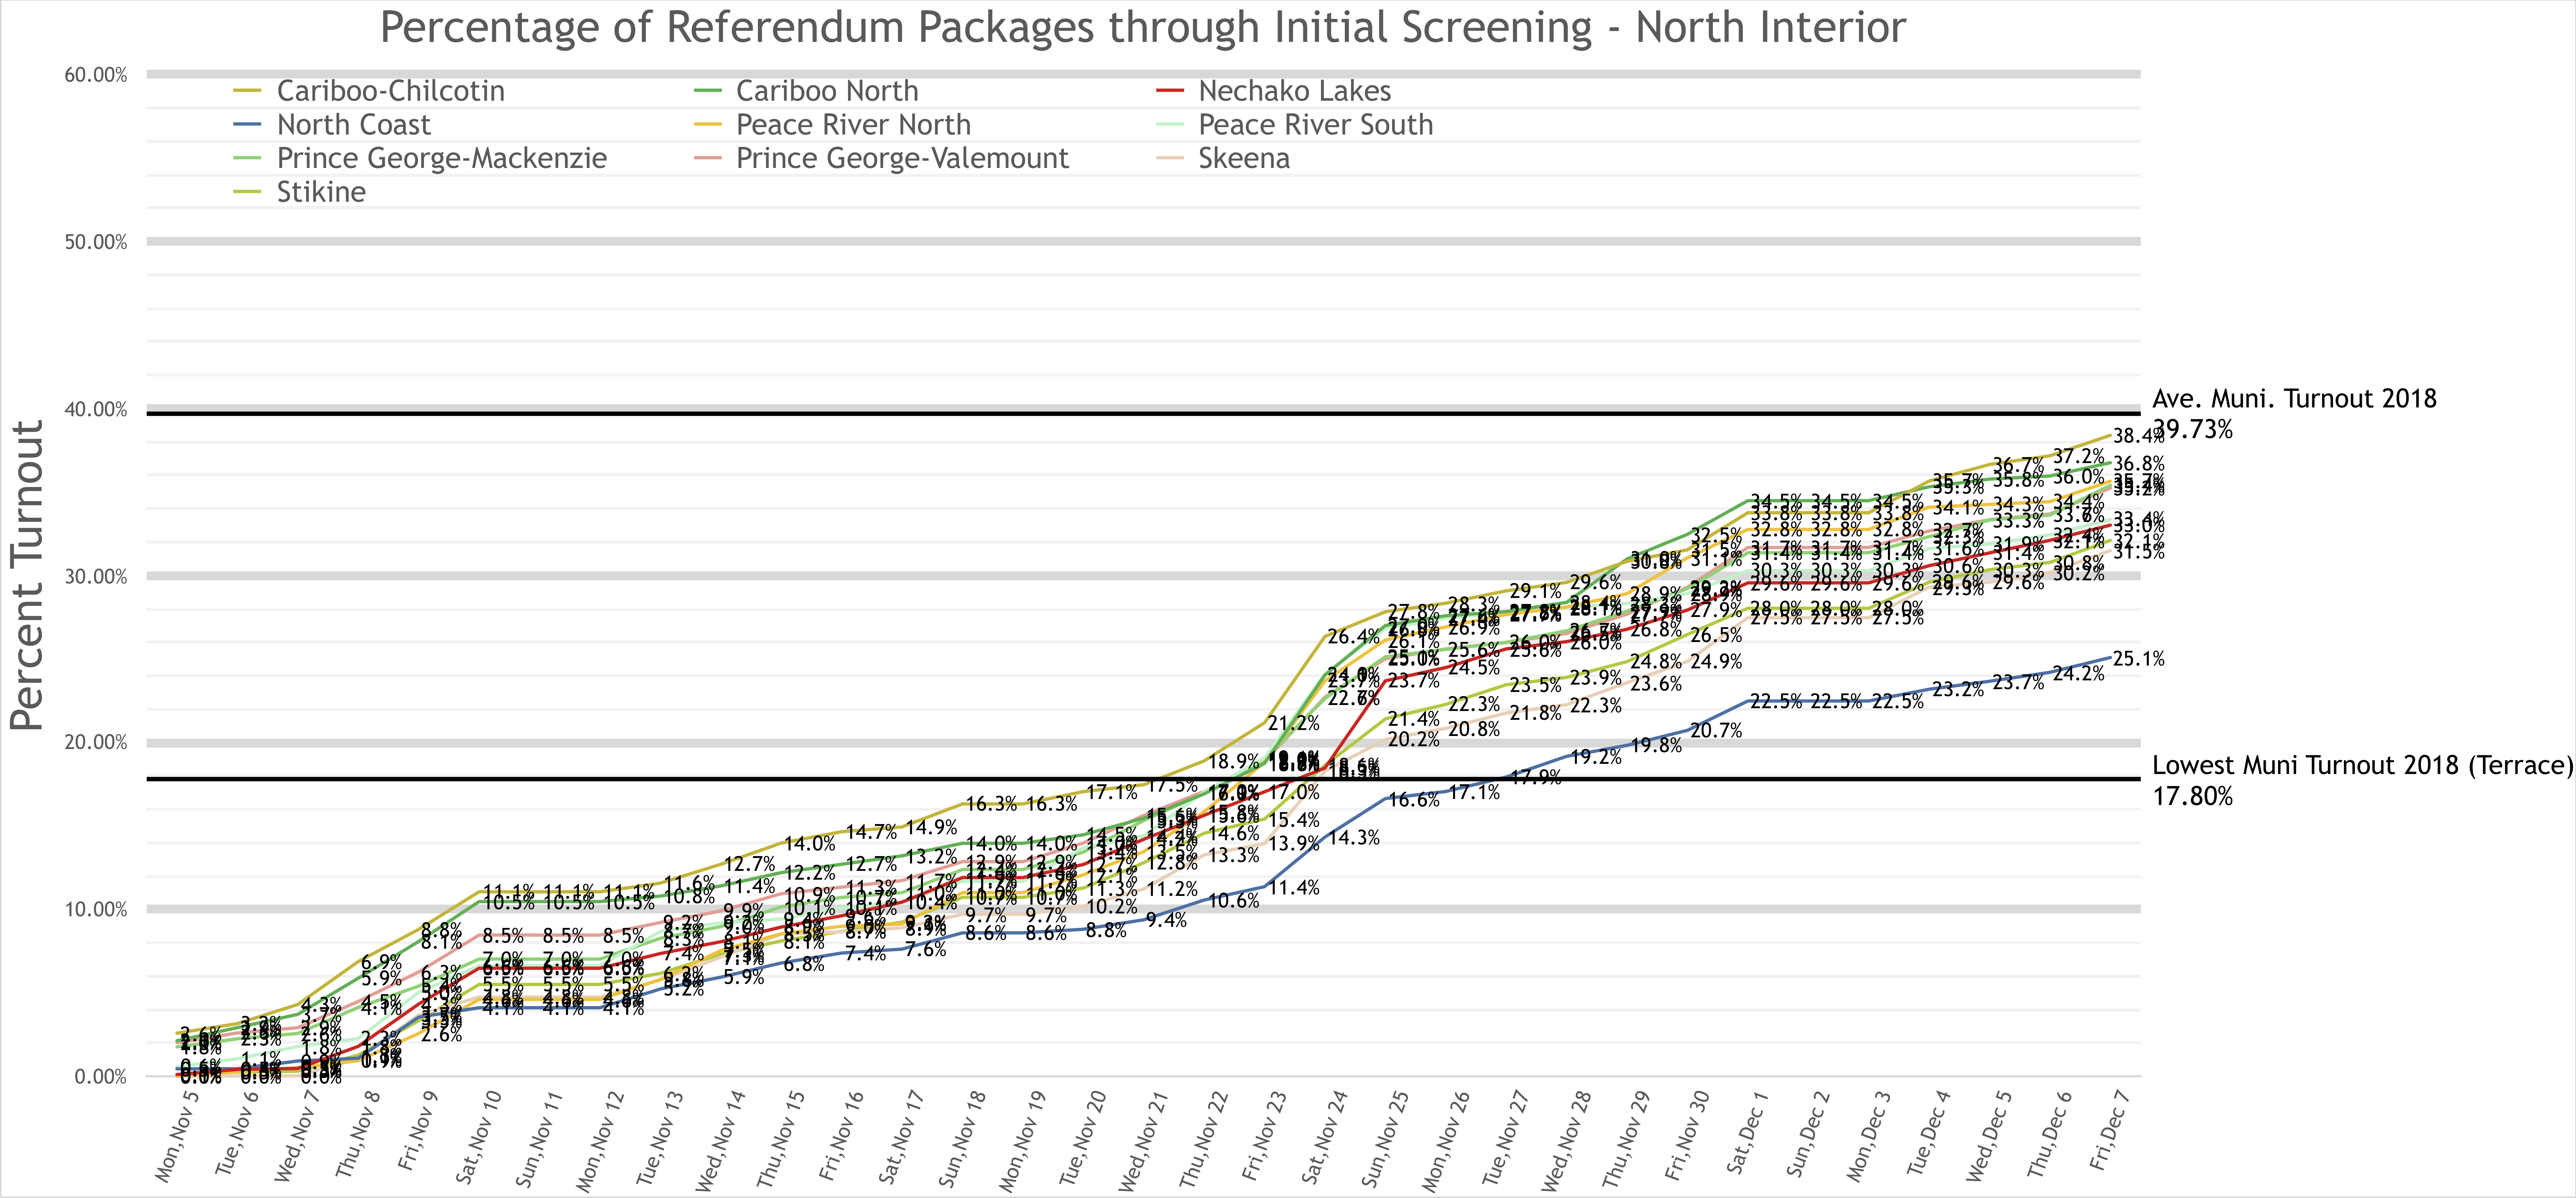
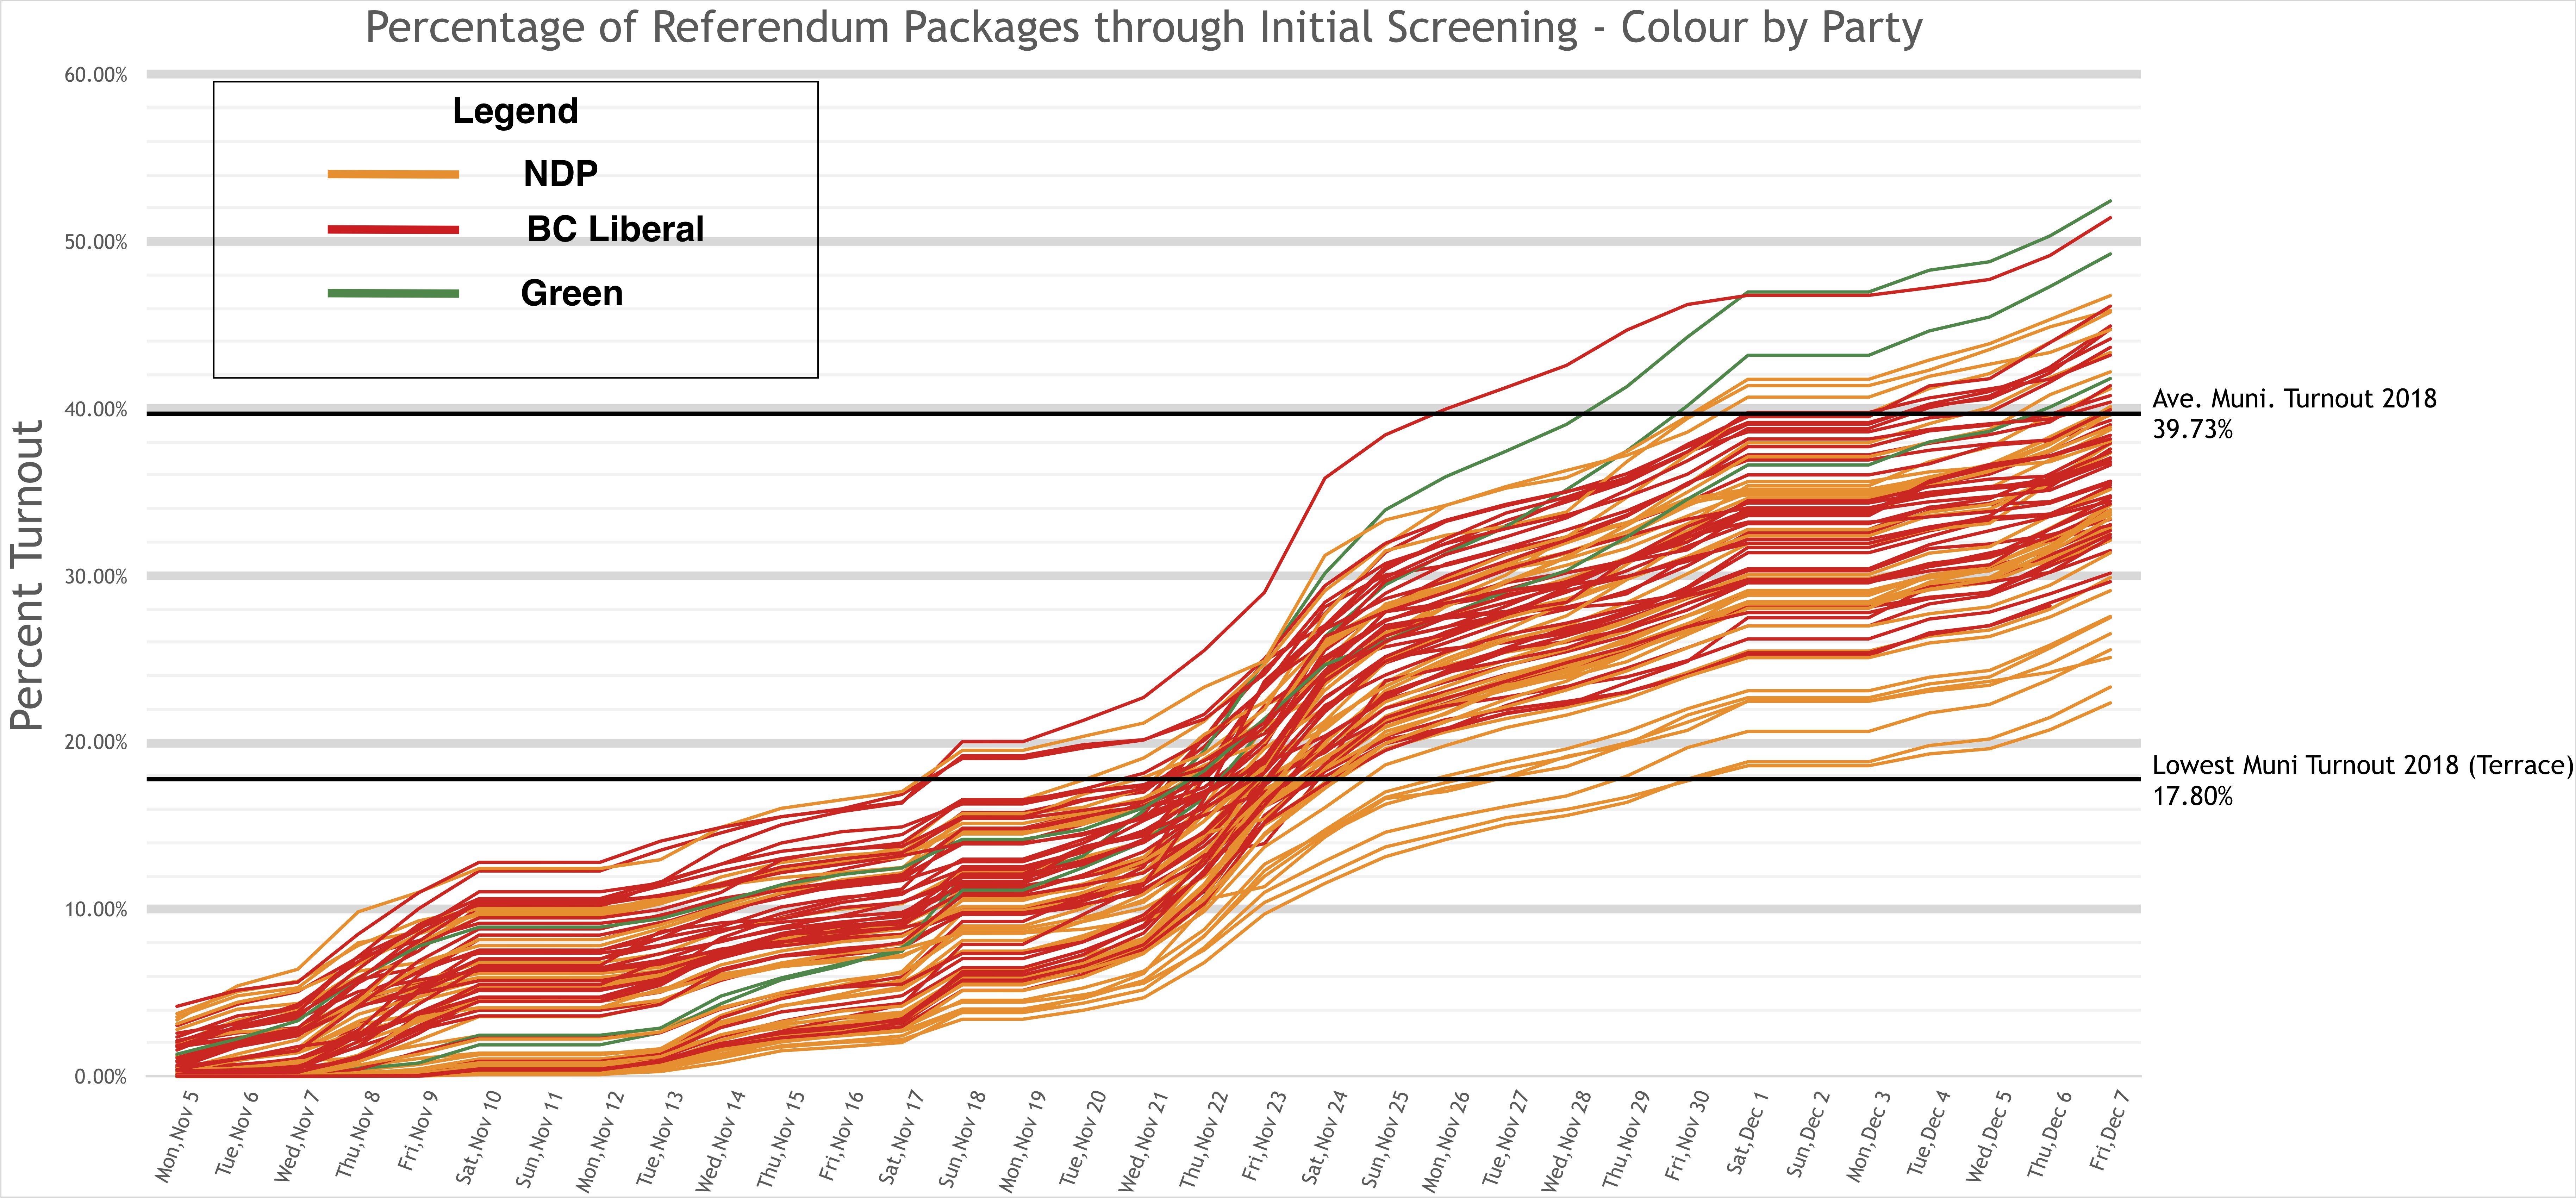
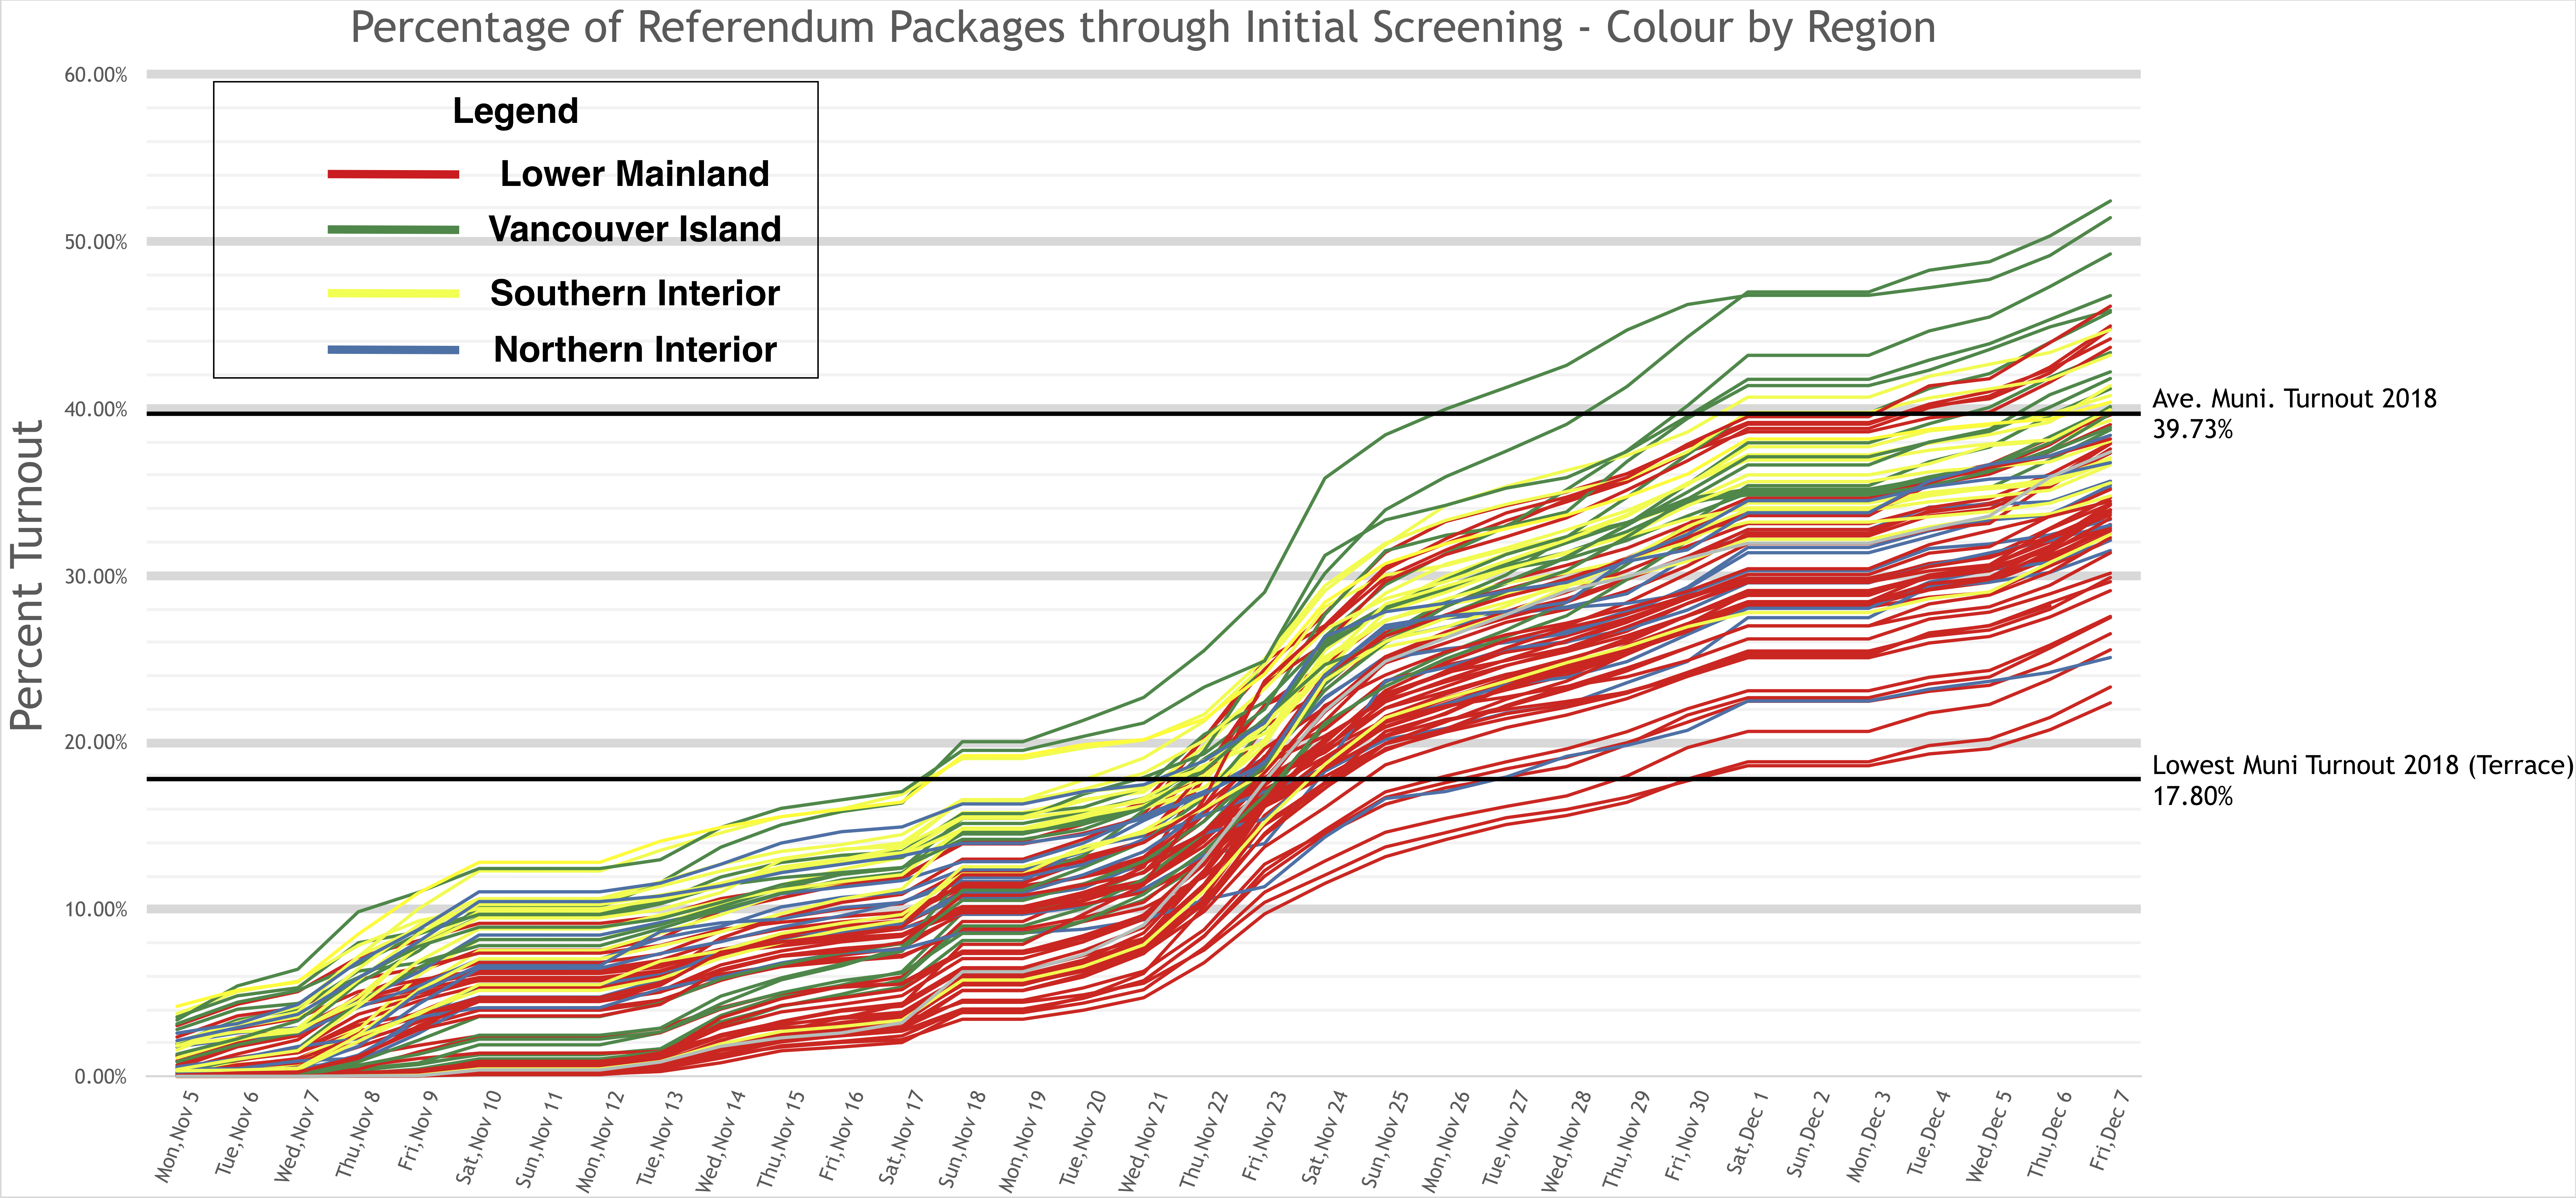
I have just finished off the graphs up to their last update on December 7 and posted a thread on Twitter. Below you’ll find the graphs and the thread. Also, here is the Numbers spreadsheet I did it in, and an export to Excel as well.

The Twitter Thread:
What’s “initial screening” check out this handy explainer on the whole ballot counting process from Elections BC!
You must be logged in to post a comment.